¿Cómo podemos ayudar?
New Google Analytics 4 Interface (tracking data of 3DVista VT PRO tours)
In this tutorial you can learn how to use Google Analytics with 3DVista VT PRO tours. The tutorial was made using Google Analytics v3. https://www.youtube.com/watch?v=vZ5cvr-6AyE
Although everything works the same, v4 of Google Analytics have brought some changes in the workflow to obtain the tracked data. Here is a screenshot showing how to get them now:
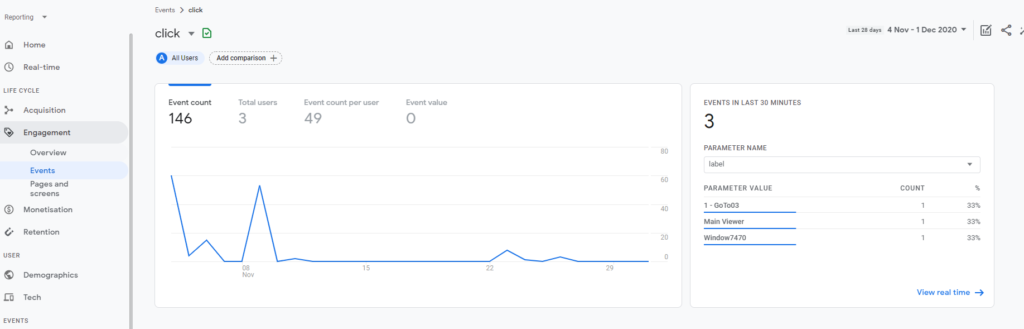
In "Events", you select the type of event, in this case "click", which opens this window.
On the right, select "label", and you will see the results sorted by "labels". The "1 – GoTo3" is a hotspot (Panorama called 1 and hotspot called GoTo3). If you select Category, you will see how many clicks in hotspots in total you got, and so on…